GA4 Advance Analytics Report
GA4 Advance Analytics Report connects to your
Google Analytics 4 (GA4) property and provides a
centralized analytics dashboard for monitoring user activity, traffic trends, and key performance metrics.
Built using Adobe App Builder, this application allows administrators and analysts to
view GA4 insights in one place without switching between tools.
Where the Data Comes From
This application retrieves analytics data directly from your
Google Analytics 4 (GA4) property using the
Google Analytics Data API.
To use the dashboard, you must connect your GA4 property by providing:
- GA4 Property ID
- Google Cloud Service Account JSON key
The metrics displayed (such as Active Users, Sessions, New Users, Events, Revenue, and Conversions)
are retrieved directly from your Google Analytics 4 (GA4) property.
This application does not collect or generate data on its own. It only visualizes the data available in your GA4 property.
If your GA4 property is configured to track a website or application (including an Adobe Commerce storefront),
those analytics can be viewed in this dashboard.
For Adobe Commerce storefronts (including Edge Delivery Services storefronts),
data must be sent to GA4 using storefront tracking integrations.
Refer to the official documentation:
Adobe Commerce Storefront Data Collection (GA4)
Key Features
- Unified KPI tracking (Active Users, Sessions, New Users, Page Views, Revenue, Conversions)
- Interactive trend visualizations
- Detailed metric drill-down views
- Time-based comparison across different date ranges
- Real-time data retrieval from GA4
Installation & Configuration
Prerequisites
-
A Google Analytics 4 (GA4) property must be active and collecting data.
-
A Google Cloud Platform (GCP) project must be created with the
Google Analytics Data API enabled.
GA4 Data API Setup Guide
-
A Service Account must be created and a JSON key generated.
Create Service Account Key
-
The Service Account email must be granted Viewer access in your GA4 Property.
Access the App
- This app does not require manual installation or source-code deployment.
- Once provisioned, it is accessible through Adobe Experience Cloud.
- Users must log in with their Adobe organization account.
-
This application is distributed via Adobe Exchange.
Learn how to install apps from Adobe Exchange
GA4 Configuration
Connect your Google Analytics 4 property to get started.
How to Get Credentials
-
Google Cloud Console → IAM & Admin → Service Accounts → Create → Key → JSON → Download
-
Enable API: APIs & Services → Library → Google Analytics Data API → Enable
-
GA4 Admin → Property Access Management → Add service account email as Viewer
-
Property ID: GA4 Admin → Property Settings → copy numbers only (e.g. 123456789)
App Functionality
1. GA4 Configuration Setup
Upon launching the app, you will be prompted to connect your GA4 property.
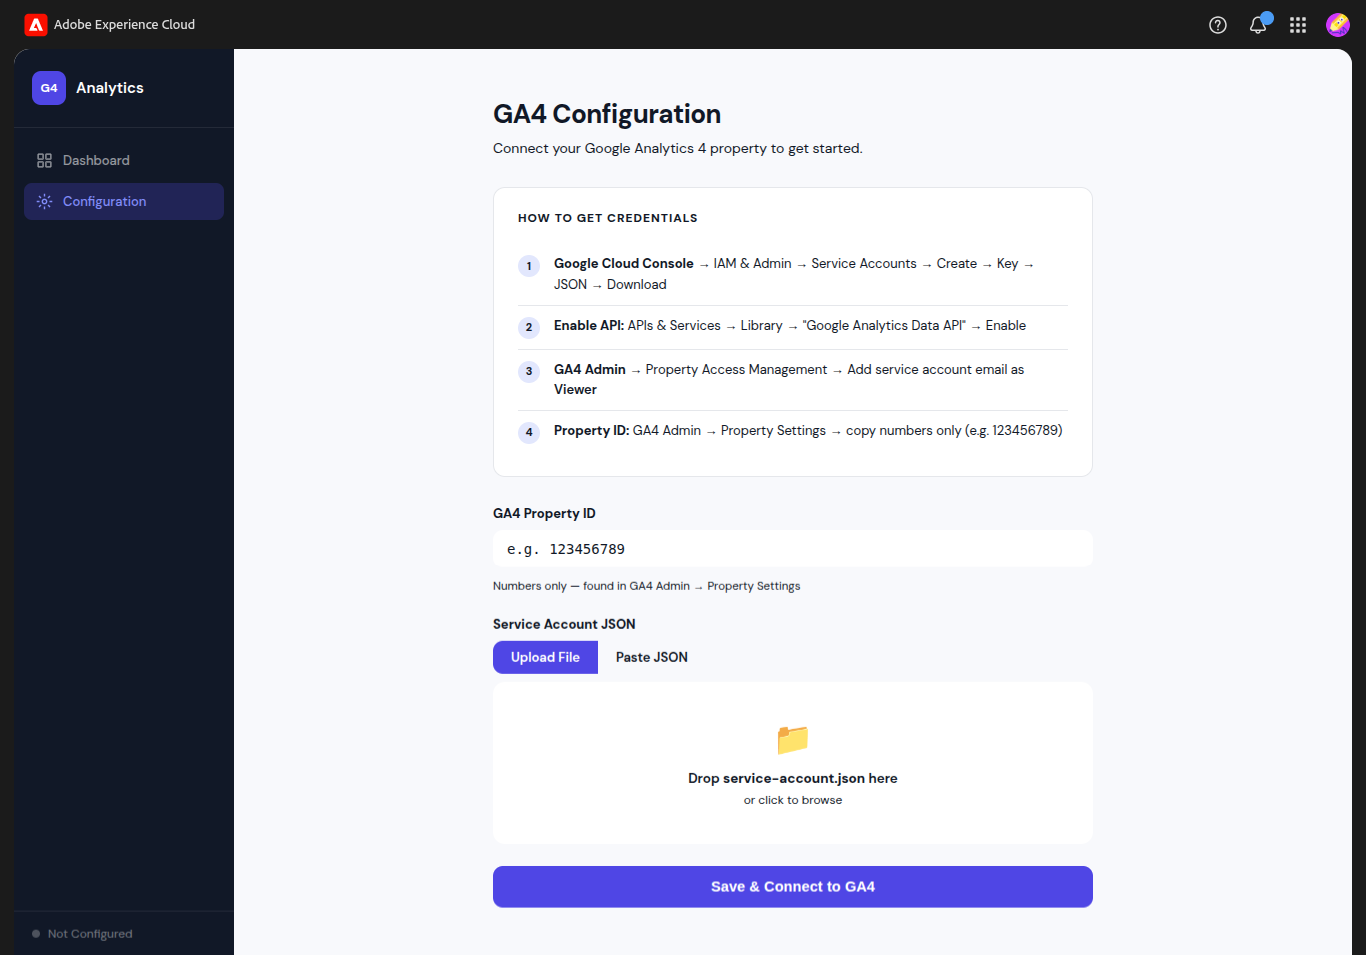
- Enter your GA4 Property ID
- Upload or paste your Service Account JSON
- Click Save & Connect to GA4
2. Connection Validation
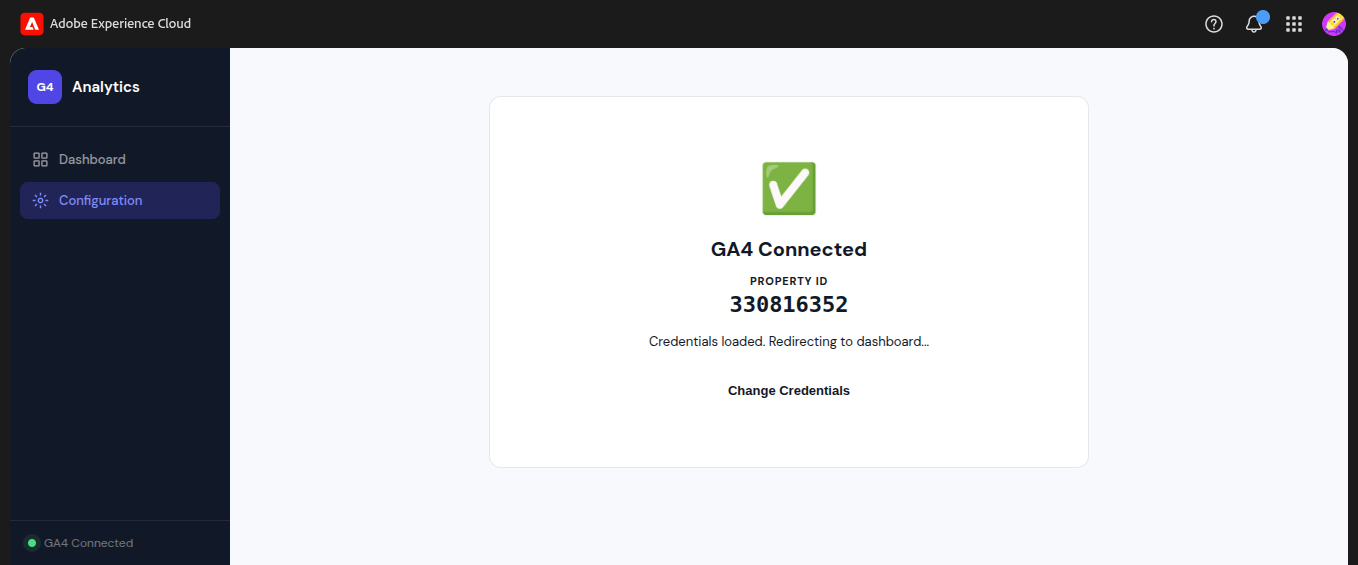
- A success message confirms connection
- Property ID is validated
- Redirects to dashboard
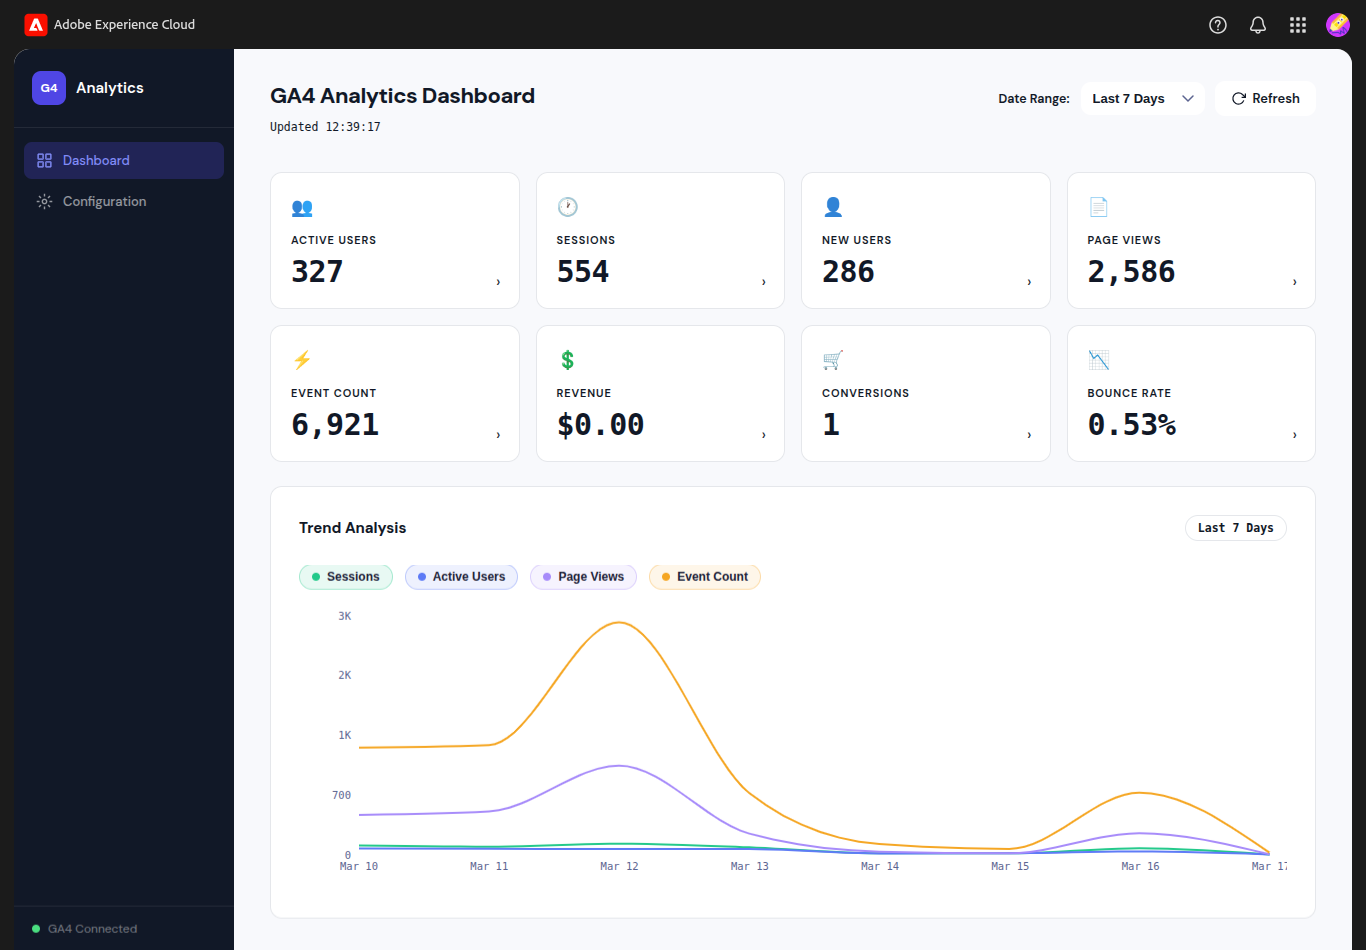
3. Dashboard Overview
-
KPI Tiles: Active Users, Sessions, New Users, Page Views, Event Count, Revenue, Conversions, Bounce Rate
-
Date Range Filter: Select time period (e.g., Last 7 Days)
-
Trend Chart: Visual representation of metrics over time
4. Detailed Metric Analysis
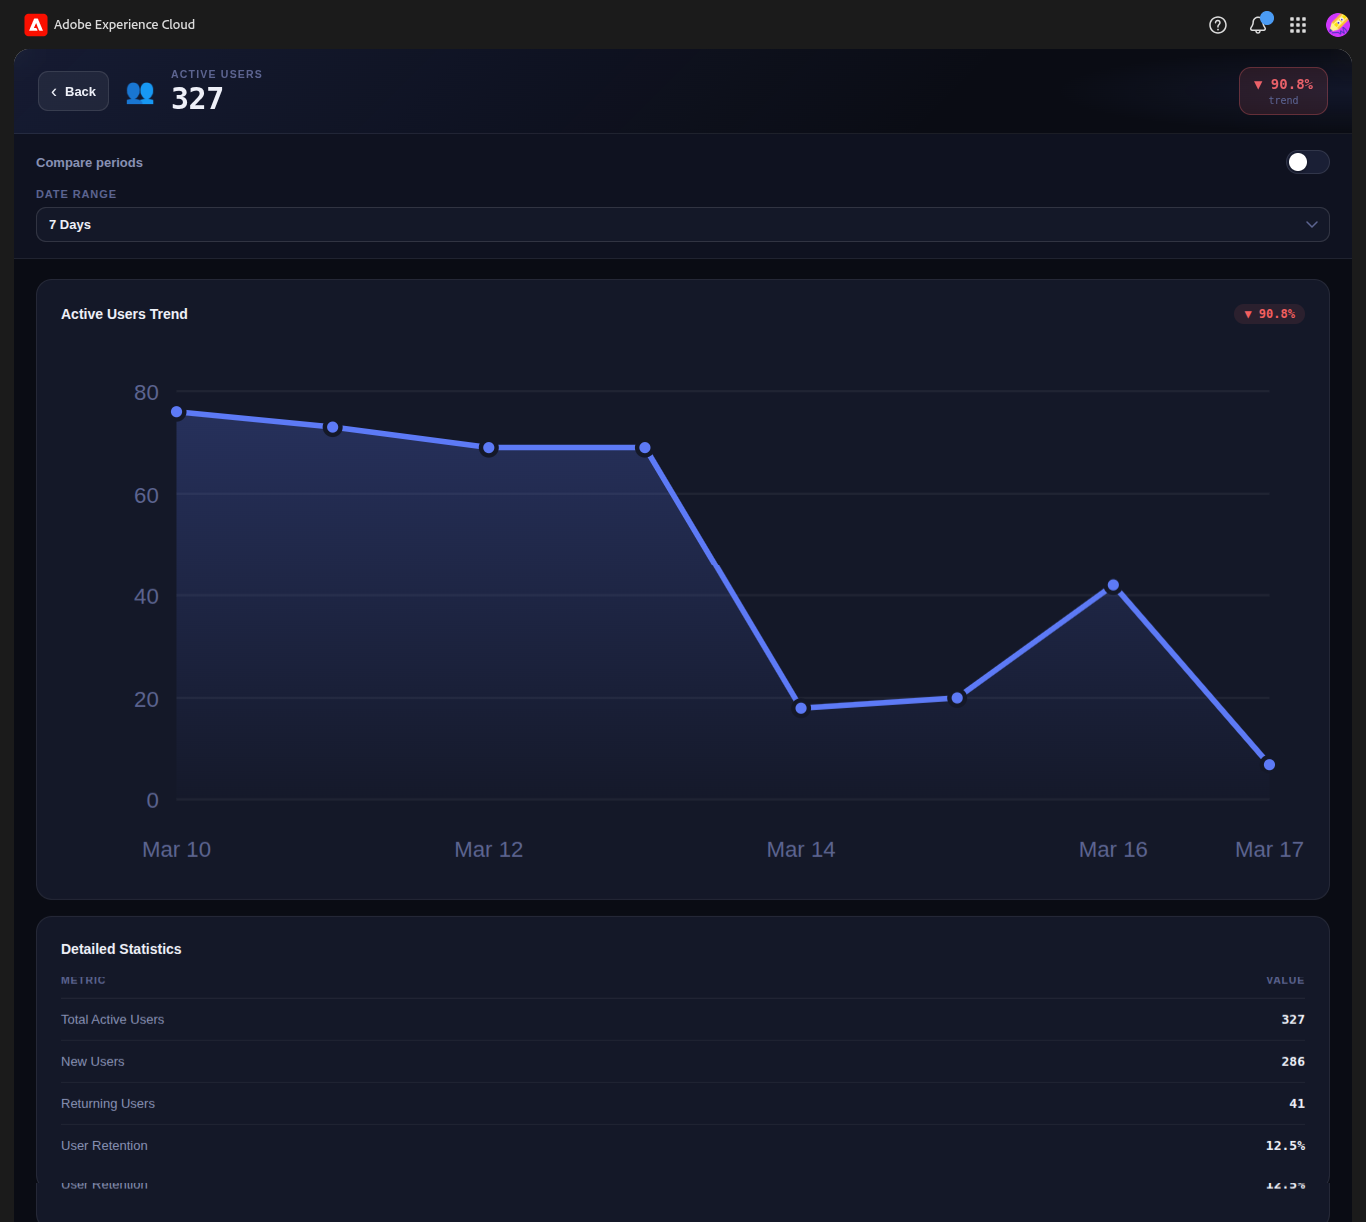
- Click any KPI to view detailed trends
- View breakdown and statistics
- Analyze performance patterns
5. Time-Based Comparison
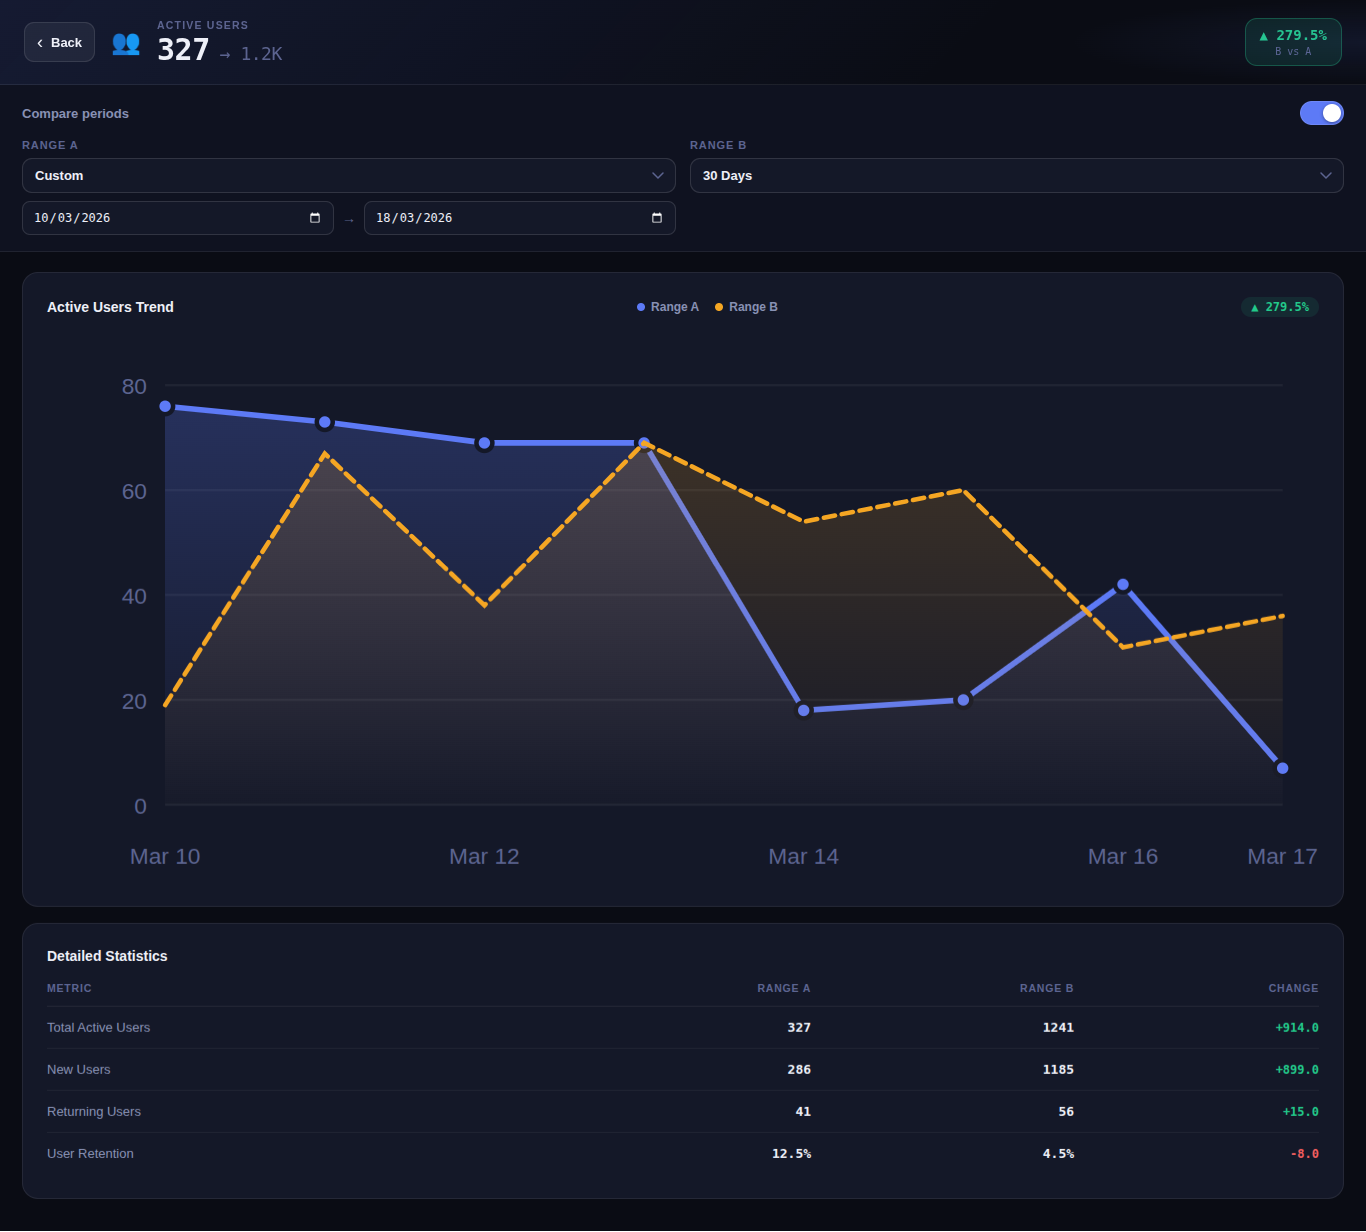
- Enable Compare Periods
- Select two date ranges
- View percentage change and trend comparison
This feature helps identify growth trends, seasonal changes, and performance differences over time.
Notes
- This app reads data directly from GA4 and does not modify or store analytics data permanently.
- Data availability depends on your GA4 configuration and tracking setup.
- No automatic integration with external platforms is performed.